New Transparency Data Provides Insights Into How to Lower Healthcare Costs
Learn more about the cost wave coming to employers and how Garner's innovative approach creates guaranteed cost savings while enriching benefits for employees.
With the government-mandated price transparency data, employers can now see what a healthcare service actually costs for nearly every location, provider, and procedure.
That visibility exposes a staggering problem. Garner's data science team found an average 800% variation in the price of common procedures within the same city. But seeing the prices is not the same as acting on them, and the transparency tools most plans rely on were never built to close that gap.
Healthcare price transparency data reveals an 800% swing in procedure costs
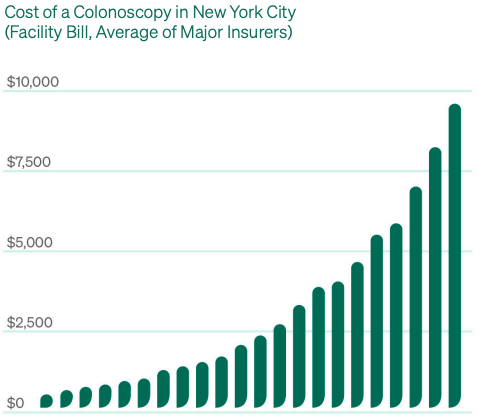
Consider a single colonoscopy in New York City. Across facilities in the same market, the price runs from as low as $300 to nearly $10,000. That is a 30x difference for the exact same procedure, and it is not a random outlier. Across common procedures, the average price varies 800% among providers in the same geography. If patients consistently chose the most efficient provider, overall healthcare costs would fall 62%, or $7,542 per employee per year.
Why price transparency tools alone don't lower costs
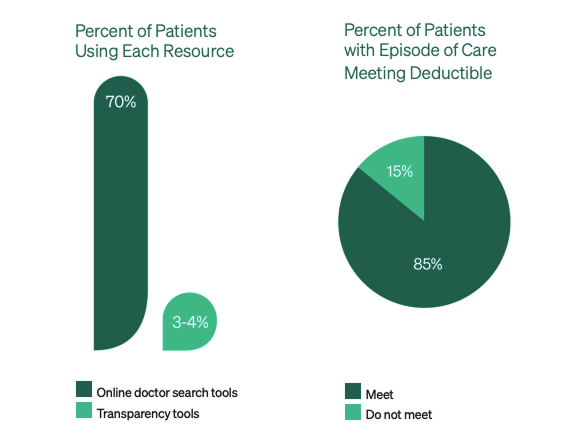
The idea that patients will shop for cheaper care has been around for nearly 20 years, and the evidence is clear that it does not work. Only 3 to 4% of patients use digital tools to find a lower-cost location for a procedure, while more than 70% use digital tools to find a new doctor. People do not comparison-shop for an MRI or a lab. They trust their doctor's referral.
Plan design makes it worse. Among employees in high-deductible plans who have a major episode of care, 85% spend through their deductible. The members who drive most of the spending have almost no financial reason to seek a lower-cost option. More price data, presented more simply, does not change either pattern.
What turns transparency data into lower plan costs
For this data to change behavior, it has to reach employees at the moment they are choosing a doctor, paired with an incentive strong enough to move the decision. That is how Garner is built.
Rather than rely on industry-standard episode groupers, Garner ranks physicians from the bottom up, measuring each individual clinical decision a doctor makes. This method already accounts for where a doctor sends their MRIs, labs, and surgeries and folds those downstream costs into each doctor's total cost of care, so the new transparency data plugs directly into the existing process and sharpens it.
On the incentive side, Garner helps cover employees' out-of-pocket costs when they see the best-performing doctors in their network. That resolves the engagement gap that has held transparency programs back for nearly two decades because it rewards the decision at exactly the point patients are already making it. This combination is what produces results the price data alone never could: a 43% employee engagement rate each year, and a 27% lower total cost of care per episode.
The full white paper goes further on:
- Garner's data-science assessment of the insurers' machine-readable files, including where they still fall short
- Why apples-to-apples price comparisons require historical claims data, and the 50 billion claims behind Garner's view
- How Garner's bottom-up physician ranking converts raw transparency data into more accurate doctor recommendations
- The two decades of evidence on why care shopping has never moved the needle