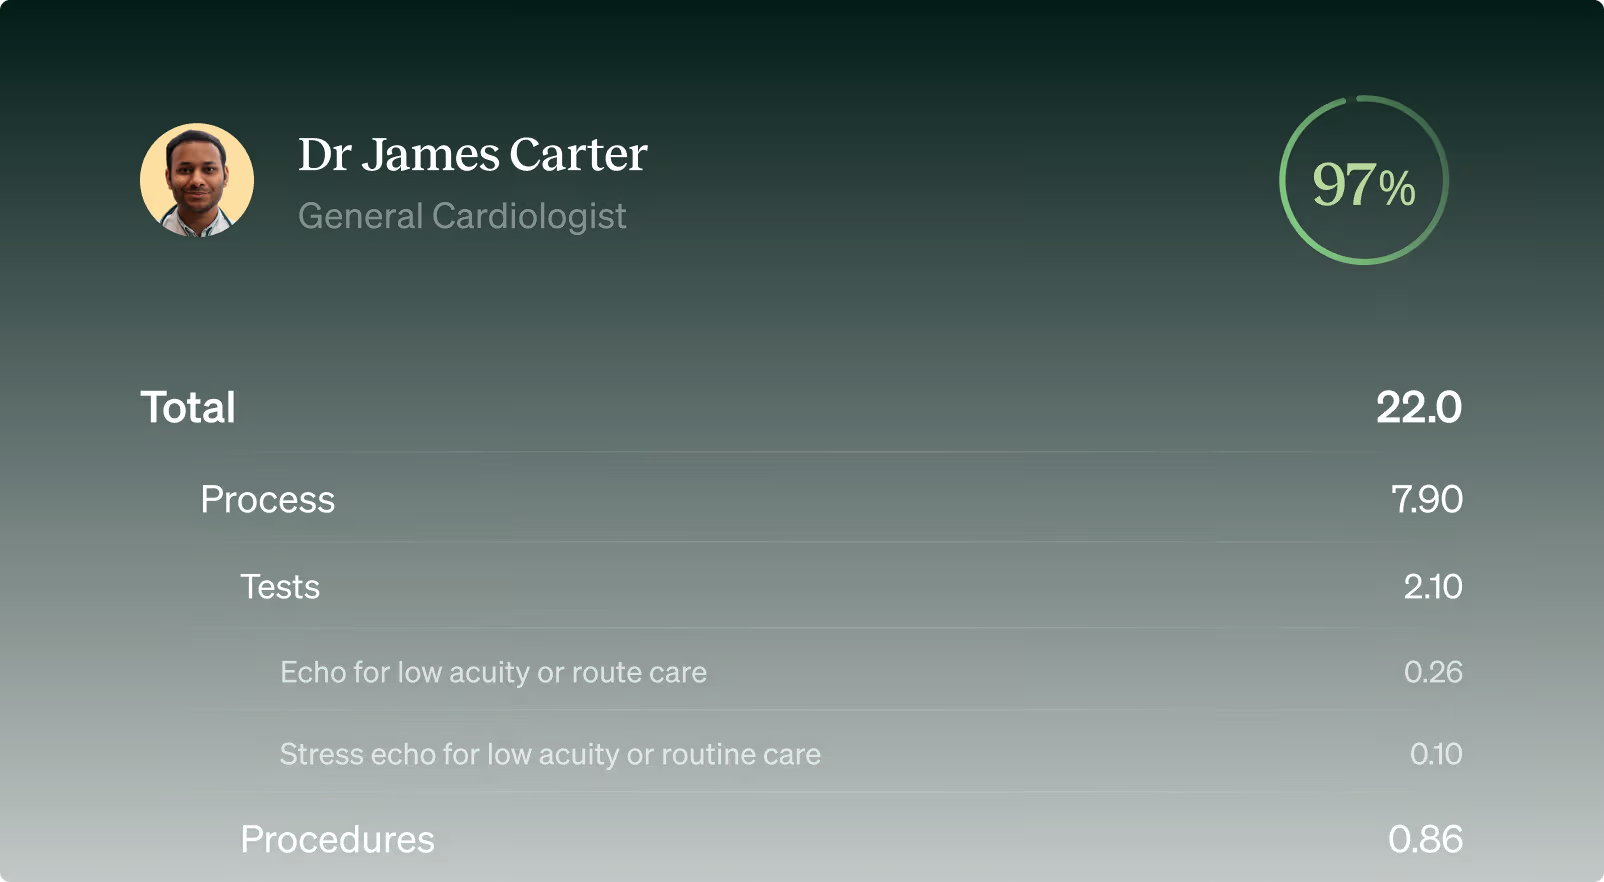
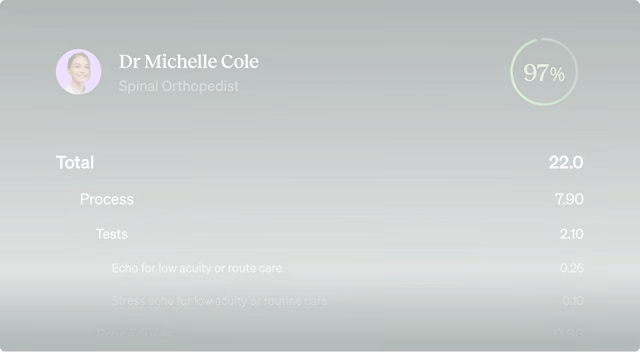
Garner’s new approach provides unprecedented visibility into the performance of individual doctors
Wyoming
Complication rate after joint replacement surgery
Patients in Garner’s dataset
423,631
All Providers
Top Providers
5.1%
2.3%
Savings if all patients saw Top Providers
$4,205,209
West Virginia
Complication rate after joint replacement surgery
Patients in Garner’s dataset
1,703,717
All Providers
Top Providers
4.1%
2.5%
Savings if all patients saw Top Providers
$8,024,079
Wisconsin
Complication rate after joint replacement surgery
Patients in Garner’s dataset
4,638,062
All Providers
Top Providers
3.8%
1.9%
Savings if all patients saw Top Providers
$42,776,509
Washington
Complication rate after joint replacement surgery
Patients in Garner’s dataset
6,718,946
All Providers
Top Providers
3.9%
1.9%
Savings if all patients saw Top Providers
$45,333,371
Vermont
Complication rate after joint replacement surgery
Patients in Garner’s dataset
519,096
All Providers
Top Providers
3.5%
1.7%
Savings if all patients saw Top Providers
$1,870,929
Virginia
Complication rate after joint replacement surgery
Patients in Garner’s dataset
8,085,692
All Providers
Top Providers
4.1%
2.1%
Savings if all patients saw Top Providers
$67,263,675
Utah
Complication rate after joint replacement surgery
Patients in Garner’s dataset
3,087,235
All Providers
Top Providers
4.8%
2.8%
Savings if all patients saw Top Providers
$22,481,391
Texas
Complication rate after joint replacement surgery
Patients in Garner’s dataset
26,638,739
All Providers
Top Providers
4.6%
2.4%
Savings if all patients saw Top Providers
$102,415,424
Tennessee
Complication rate after joint replacement surgery
Patients in Garner’s dataset
6,056,209
All Providers
Top Providers
4.1%
2.3%
Savings if all patients saw Top Providers
$44,039,730
South Dakota
Complication rate after joint replacement surgery
Patients in Garner’s dataset
774,264
All Providers
Top Providers
3.9%
1.7%
Savings if all patients saw Top Providers
$10,135,213
South Carolina
Complication rate after joint replacement surgery
Patients in Garner’s dataset
4,973,665
All Providers
Top Providers
4.1%
2.0%
Savings if all patients saw Top Providers
$34,712,874
Rhode Island
Complication rate after joint replacement surgery
Patients in Garner’s dataset
1,038,402
All Providers
Top Providers
4.2%
1.8%
Savings if all patients saw Top Providers
$8,822,105
Pennsylvania
Complication rate after joint replacement surgery
Patients in Garner’s dataset
12,516,493
All Providers
Top Providers
4.5%
2.4%
Savings if all patients saw Top Providers
$91,803,430
Oregon
Complication rate after joint replacement surgery
Patients in Garner’s dataset
3,349,546
All Providers
Top Providers
3.6%
1.8%
Savings if all patients saw Top Providers
$35,039,596
Oklahoma
Complication rate after joint replacement surgery
Patients in Garner’s dataset
3,150,840
All Providers
Top Providers
4.3%
2.3%
Savings if all patients saw Top Providers
$20,500,879
Ohio
Complication rate after joint replacement surgery
Patients in Garner’s dataset
11,406,819
All Providers
Top Providers
4.1%
2.3%
Savings if all patients saw Top Providers
$81,910,973
New York
Complication rate after joint replacement surgery
Patients in Garner’s dataset
19,508,672
All Providers
Top Providers
4.3%
2.5%
Savings if all patients saw Top Providers
$77,239,074
Nevada
Complication rate after joint replacement surgery
Patients in Garner’s dataset
2,496,561
All Providers
Top Providers
5.7%
2.6%
Savings if all patients saw Top Providers
$21,474,438
New Mexico
Complication rate after joint replacement surgery
Patients in Garner’s dataset
1,372,490
All Providers
Top Providers
6.2%
2.8%
Savings if all patients saw Top Providers
$13,811,437
New Jersey
Complication rate after joint replacement surgery
Patients in Garner’s dataset
8,181,383
All Providers
Top Providers
4.7%
2.5%
Savings if all patients saw Top Providers
$38,632,591
New Hampshire
Complication rate after joint replacement surgery
Patients in Garner’s dataset
1,191,652
All Providers
Top Providers
3.8%
2.4%
Savings if all patients saw Top Providers
$9,041,531
Nebraska
Complication rate after joint replacement surgery
Patients in Garner’s dataset
1,832,406
All Providers
Top Providers
3.2%
1.5%
Savings if all patients saw Top Providers
$14,629,258
North Dakota
Complication rate after joint replacement surgery
Patients in Garner’s dataset
712,730
All Providers
Top Providers
3.8%
1.7%
Savings if all patients saw Top Providers
$6,006,996
North Carolina
Complication rate after joint replacement surgery
Patients in Garner’s dataset
9,490,100
All Providers
Top Providers
3.9%
1.9%
Savings if all patients saw Top Providers
$48,131,728
Montana
Complication rate after joint replacement surgery
Patients in Garner’s dataset
941,643
All Providers
Top Providers
3.7%
2.0%
Savings if all patients saw Top Providers
$7,403,933
Mississippi
Complication rate after joint replacement surgery
Patients in Garner’s dataset
2,709,840
All Providers
Top Providers
4.6%
2.7%
Savings if all patients saw Top Providers
$7,140,755
Missouri
Complication rate after joint replacement surgery
Patients in Garner’s dataset
5,205,397
All Providers
Top Providers
4.2%
2.0%
Savings if all patients saw Top Providers
$45,505,204
Minnesota
Complication rate after joint replacement surgery
Patients in Garner’s dataset
4,477,722
All Providers
Top Providers
4.0%
2.2%
Savings if all patients saw Top Providers
$41,845,661
Michigan
Complication rate after joint replacement surgery
Patients in Garner’s dataset
9,108,608
All Providers
Top Providers
4.1%
2.3%
Savings if all patients saw Top Providers
$72,232,166
Maine
Complication rate after joint replacement surgery
Patients in Garner’s dataset
1,244,979
All Providers
Top Providers
3.3%
1.7%
Savings if all patients saw Top Providers
$8,315,556
Maryland
Complication rate after joint replacement surgery
Patients in Garner’s dataset
5,579,887
All Providers
Top Providers
4.1%
1.9%
Savings if all patients saw Top Providers
$50,062,147
Massachusetts
Complication rate after joint replacement surgery
Patients in Garner’s dataset
7,100,490
All Providers
Top Providers
4.1%
2.4%
Savings if all patients saw Top Providers
$30,540,004
Louisiana
Complication rate after joint replacement surgery
Patients in Garner’s dataset
4,235,731
All Providers
Top Providers
5.0%
2.7%
Savings if all patients saw Top Providers
$25,688,598
Kentucky
Complication rate after joint replacement surgery
Patients in Garner’s dataset
4,565,430
All Providers
Top Providers
4.0%
2.5%
Savings if all patients saw Top Providers
$34,364,976
Kansas
Complication rate after joint replacement surgery
Patients in Garner’s dataset
2,590,748
All Providers
Top Providers
4.2%
1.9%
Savings if all patients saw Top Providers
$27,658,665
Indiana
Complication rate after joint replacement surgery
Patients in Garner’s dataset
6,288,342
All Providers
Top Providers
4.1%
2.3%
Savings if all patients saw Top Providers
$93,820,971
Illinois
Complication rate after joint replacement surgery
Patients in Garner’s dataset
9,564,597
All Providers
Top Providers
4.3%
2.3%
Savings if all patients saw Top Providers
$75,012,494
Idaho
Complication rate after joint replacement surgery
Patients in Garner’s dataset
1,536,961
All Providers
Top Providers
3.7%
1.5%
Savings if all patients saw Top Providers
$11,753,498
Iowa
Complication rate after joint replacement surgery
Patients in Garner’s dataset
2,770,722
All Providers
Top Providers
3.3%
1.7%
Savings if all patients saw Top Providers
$17,732,195
Hawaii
Complication rate after joint replacement surgery
Patients in Garner’s dataset
1,211,542
All Providers
Top Providers
3.6%
2.0%
Savings if all patients saw Top Providers
$2,401,402
Georgia
Complication rate after joint replacement surgery
Patients in Garner’s dataset
10,298,654
All Providers
Top Providers
4.2%
1.9%
Savings if all patients saw Top Providers
$56,049,517
Delaware
Complication rate after joint replacement surgery
Patients in Garner’s dataset
883,056
All Providers
Top Providers
3.2%
2.0%
Savings if all patients saw Top Providers
$5,589,227
Connecticut
Complication rate after joint replacement surgery
Patients in Garner’s dataset
3,339,602
All Providers
Top Providers
3.8%
2.0%
Savings if all patients saw Top Providers
$21,900,709
Colorado
Complication rate after joint replacement surgery
Patients in Garner’s dataset
4,304,984
All Providers
Top Providers
4.9%
1.9%
Savings if all patients saw Top Providers
$45,873,780
Arizona
Complication rate after joint replacement surgery
Patients in Garner’s dataset
5,861,650
All Providers
Top Providers
4.6%
2.9%
Savings if all patients saw Top Providers
$35,804,070
Arkansas
Complication rate after joint replacement surgery
Patients in Garner’s dataset
2,888,848
All Providers
Top Providers
4.6%
2.2%
Savings if all patients saw Top Providers
$13,704,202
California
Complication rate after joint replacement surgery
Patients in Garner’s dataset
27,872,928
All Providers
Top Providers
4.7%
2.1%
Savings if all patients saw Top Providers
$153,880,719
Alabama
Complication rate after joint replacement surgery
Patients in Garner’s dataset
4,459,724
All Providers
Top Providers
4.6%
2.3%
Savings if all patients saw Top Providers
$20,070,257
Alaska
Complication rate after joint replacement surgery
Patients in Garner’s dataset
466,985
All Providers
Top Providers
4.7%
1.4%
Savings if all patients saw Top Providers
$3,197,356
Florida
Complication rate after joint replacement surgery
Patients in Garner’s dataset
19,934,250
All Providers
Top Providers
4.9%
2.6%
Savings if all patients saw Top Providers
$116,557,382
District of Columbia
Complication rate after joint replacement surgery
Patients in Garner’s dataset
667,726
All Providers
Top Providers
4.1%
1.8%
Savings if all patients saw Top Providers
$38,153,336
We have gathered 5x more data than the national insurance carriers, and 10x more data than other navigation and transparency vendors, including data on 320 million+ patients, accounting for 75% of all claims data nationwide
To accomplish this, Garner has made a significant advancement by acquiring and merging divergent datasets from commercial, Medicare and Medicaid patients, as well as the latest healthcare cost transparency data
We have developed 550+ clinical and financial metrics across 82+ distinct medical specialties, at least 5x more metrics than other cost and quality vendors


Together, our data and our metrics allow us to construct the most accurate picture of physician quality and efficiency available today

Choose your provider with confidence
For Employers
Improve care quality and reduce healthcare spend — without changing plans or networks.
For Advisors
Offer clients a nondisruptive benefit that drives employee engagement and real savings.
For Health Plans
Use the Garner app to find the best doctors in your network, and get help covering your medical bills.
For Providers
Power value-based care and growth with Garner’s data-driven provider insights.