For providers

Best-in-class data to assess provider performance

Garner delivers trusted, performance-based insights to better understand provider performance, inform high-quality referrals, and improve outcomes at scale.

Medical professional in a white coat analyzing patient data on a computer screen in a modern clinical office.
75%
of all claims data in the United States
550+
specialty-specific quality and efficiency metrics
92%
accuracy of our phone and address directory
Map of the United States showing state boundaries with numerous white dots scattered across each state representing specific locations.

One of the most robust medical claims datasets in the U.S.

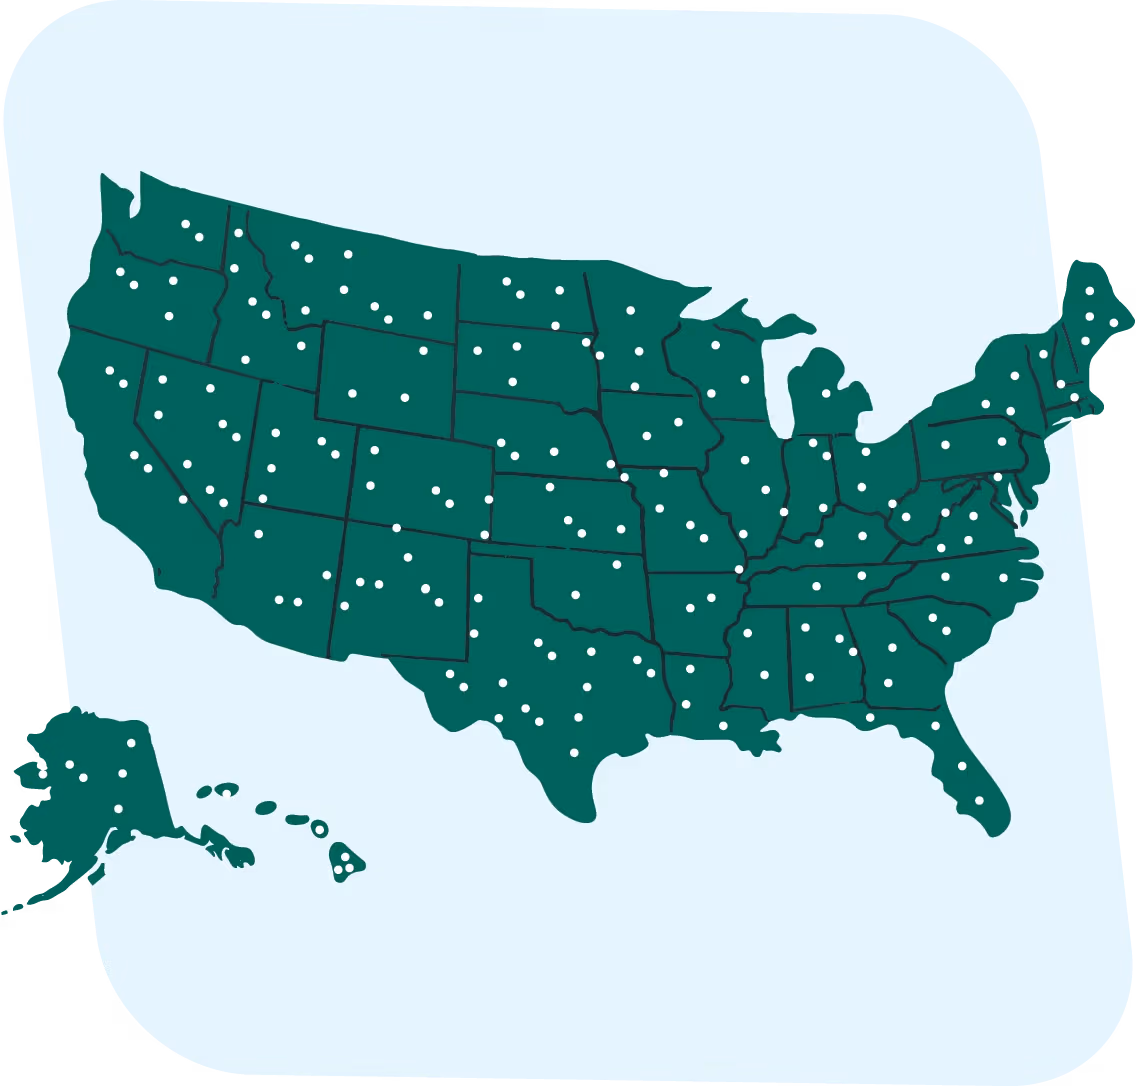
Garner’s dataset includes over 60 billion medical records from 320 million patients, enriched with hospital and health plan transparency data. Our best-in-class data enables a deeper, more accurate view of provider cost and quality.

Accurate and transparent performance insights generated through a unique, bottom-up methodology

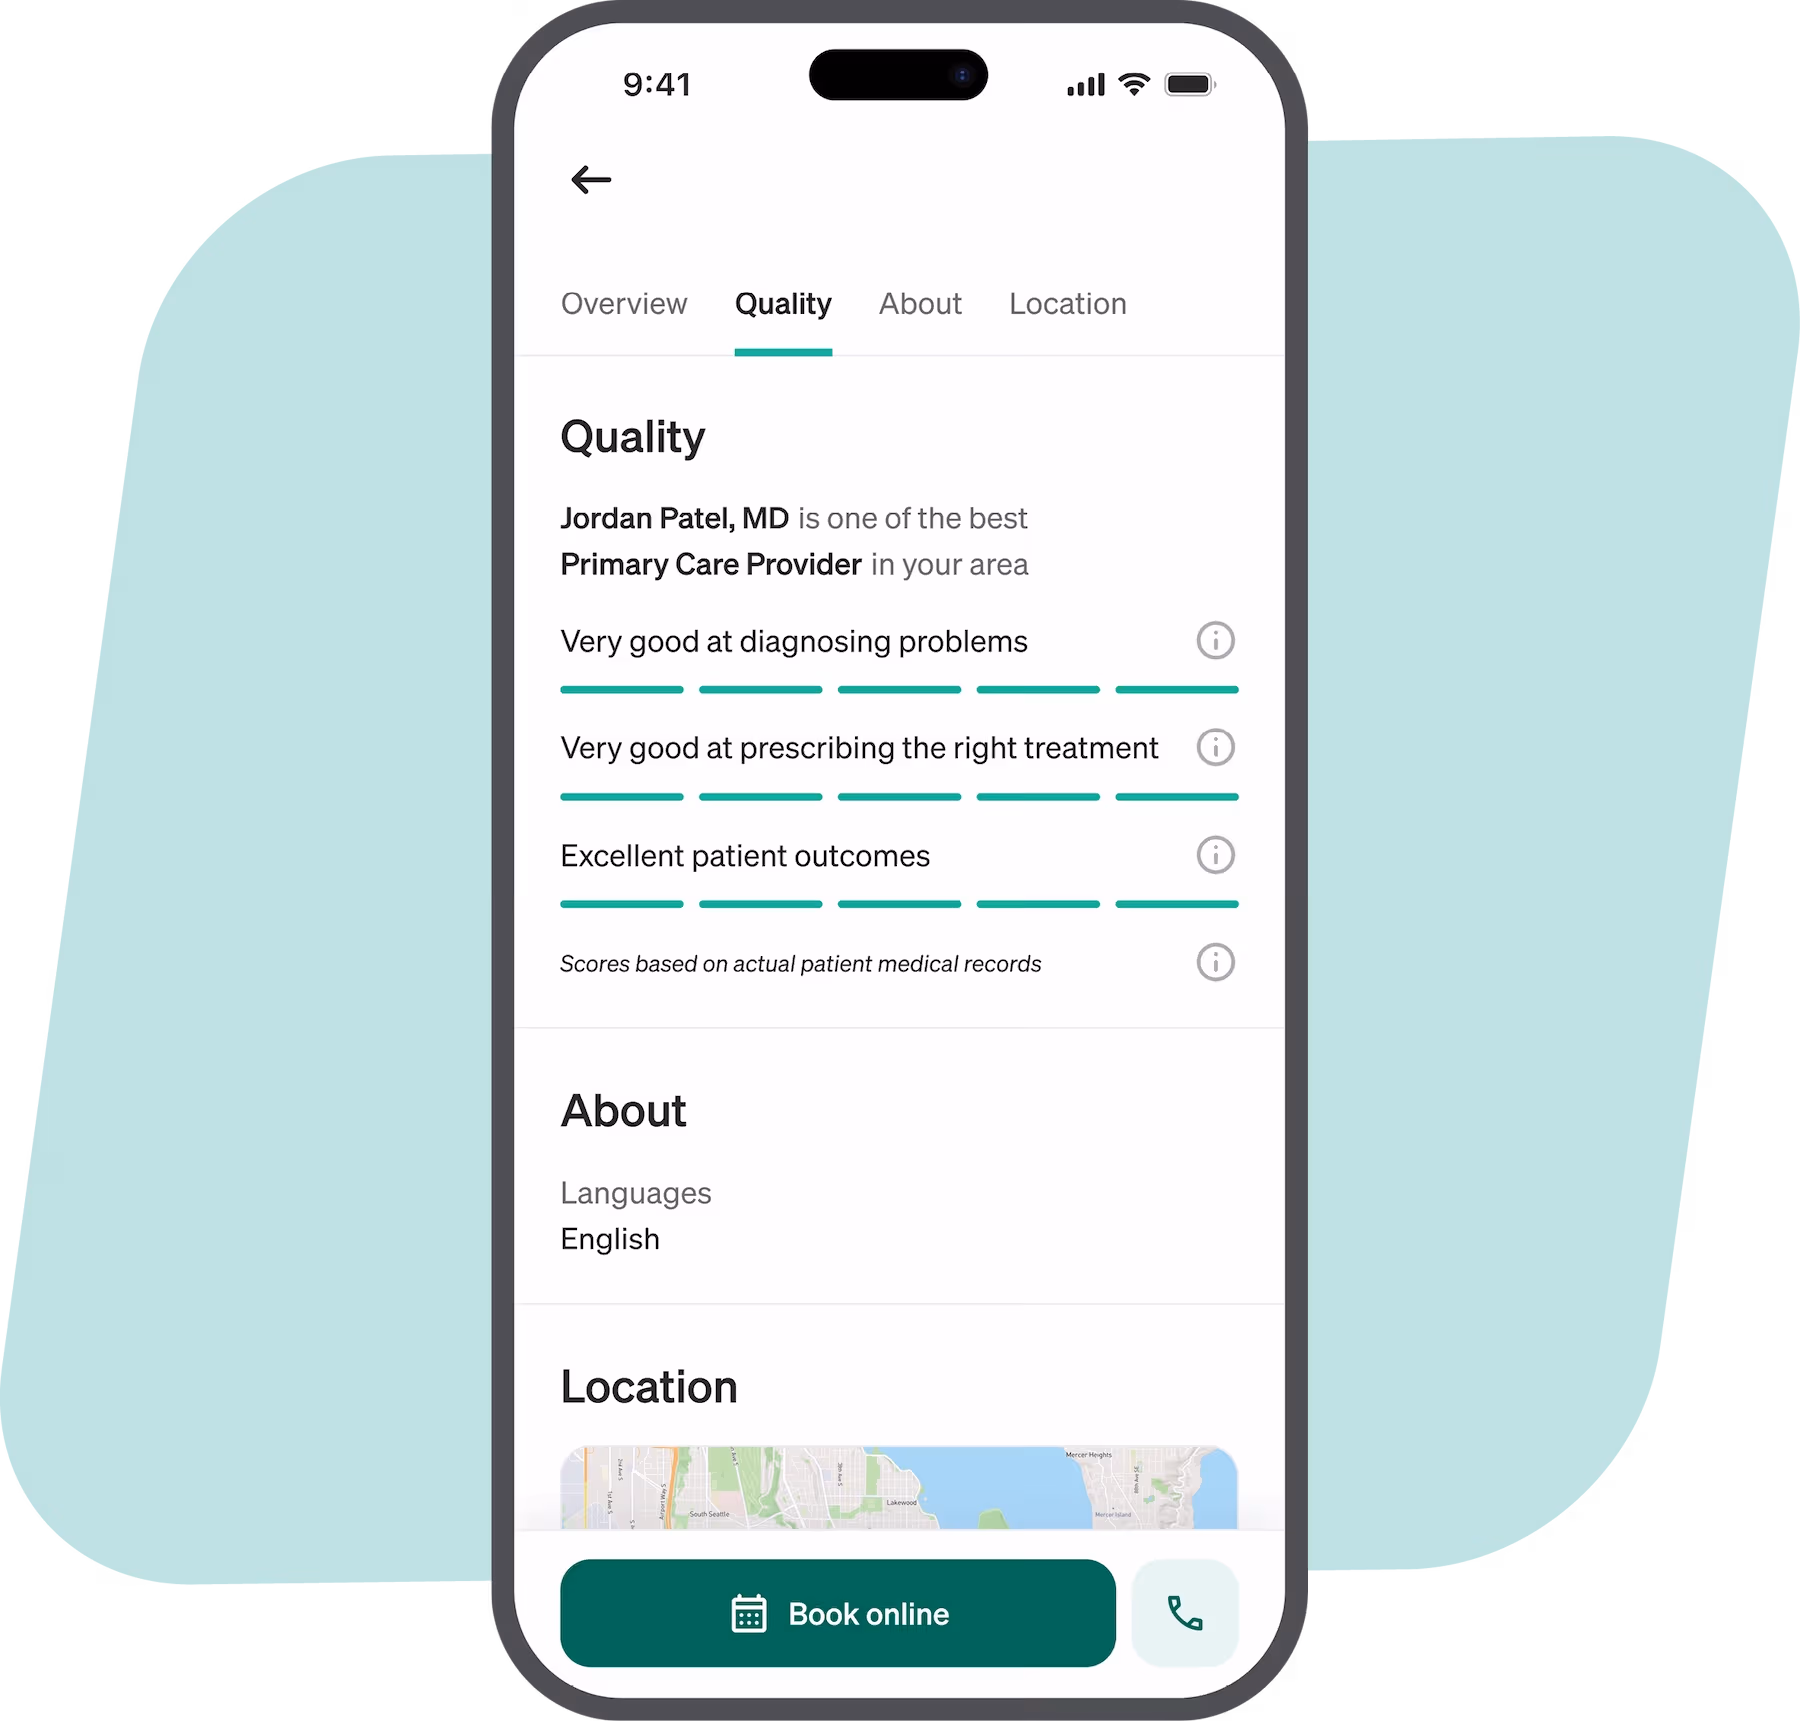
Garner has developed over 550 specialty-specific metrics, enabling us to pinpoint providers who deliver evidence-based care and achieve excellent patient outcomes.

Woman checking her smartphone with dollar symbols floating beside her, suggesting financial or payment activity.

A more accurate provider directory, powered by advanced AI

Garner combines data science and AI to achieve 92% accuracy for phone, address and appointment availability data.

We continuously clean, update, and refine our data to ensure best-in-class performance insights and the most trustworthy referrals.

3 ways for Providers to get started with Garner

Three teal and white circular icons each containing a green checkmark.

Modern API

Embed Garner’s provider recommendations directly into your existing care navigation or referral workflows using our flexible API.

View API docs
Black smartphone with a screen protector applied diagonally.

Intuitive user interface

Use Garner’s off-the-shelf interface to support care coordinators and referral teams. Filter results by specialty, network participation, location, language spoken, and appointment availability.

3D pie chart with eight uneven segments in various shades of green, teal, burgundy, gray, and white.

Custom insights

Work with our team to design tailored analyses and reporting for your organization’s specific clinical, operational, or strategic needs.

Resources

New Aon Study: Employers with Garner Experienced 7.4% Lower Medical Costs with No Plan Design Changes

Read more

Fertility, Menopause and the Care Gap Employers Can't Ignore | Dr. Asima Ahmad

Watch now

What's Really Driving the Healthcare Cost Crisis? Pt. II: Hospital Costs

Watch now

Discover how Garner can work for you.