Assessment of Quality and Total Cost of Care Across Individual Doctors
How do we know who the best doctors are?

Provider quality rankings have been around for years, and almost all of them have a credibility problem. The same doctor often receives radically different scores in consecutive years. The methodology penalizes physicians who handle the most complex cases. And the underlying logic sits inside a statistical black box that even its creators can't fully explain.
The result: clinicians don't trust the rankings, patients don't use them, and employers can't act on them. Garner built a fundamentally different methodology to fix this. Instead of feeding claims into an aggregator, we look at every clinical decision a doctor makes, apply over 500 proprietary clinical metrics across 82 subspecialties, and produce results that are transparent enough to share with the doctors themselves.
The U.S. healthcare system generates nearly $1 trillion a year in economic waste while ranking 37th globally on the World Health Organization's quality measures. Individual physician behavior is the single biggest factor in that gap. Top-performing doctors in every geography add three more healthy days to their patients' lives each year while lowering total cost of care by 32%.
Why previous provider rankings have been inaccurate
Almost as long as data-driven provider quality rankings have existed, results have been criticized as untrustworthy. Clinicians, patients, and benefits leaders have all complained that existing methodologies are inaccurate, undecipherable, and biased against doctors who handle the most challenging cases.
The root cause is methodology. Most existing approaches rely on episode groupers, or ETGs, which categorize all claims by disease using complex internal logic. The data is then fed into a statistical aggregator that outputs an average cost and outcome per doctor. This approach has three structural problems. It penalizes doctors who handle the most complex cases. It requires thousands of patients to reach statistical significance, leaving most doctors unscored. And it operates as a black box even to its own creators, which means neither the doctor being evaluated nor the patient looking up the score can see how it was calculated.
A different approach: bottom-up measurement
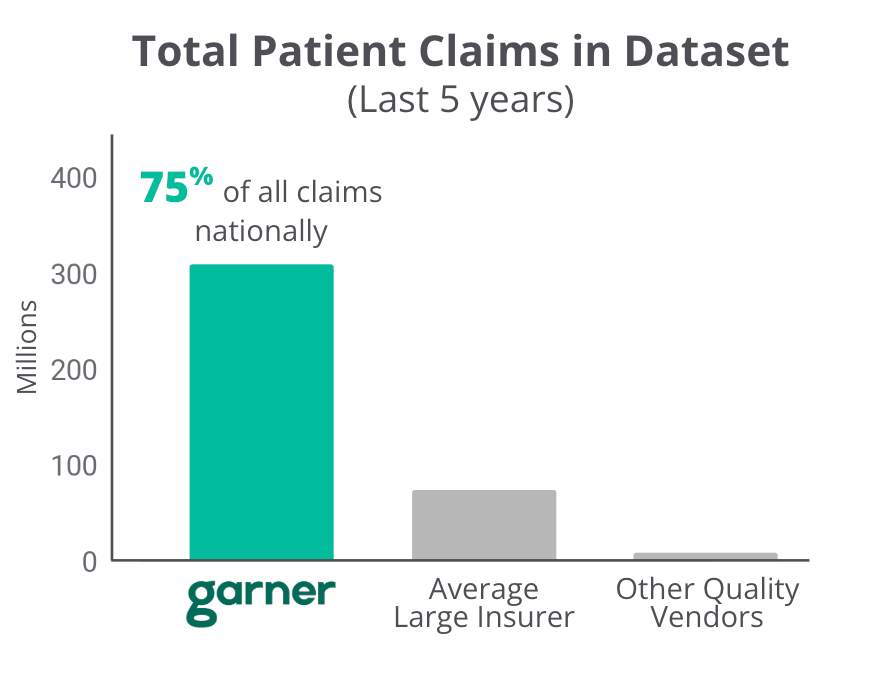
Rather than feed claims into a statistical aggregator, Garner looks at every individual clinical decision a doctor makes throughout the patient journey. This bottom-up methodology starts with one of the largest medical claims datasets in the country: 75% of all claims nationally, representing over 60 billion medical records and more than 310 million patients. That historical claims data is combined with the new healthcare transparency data to calculate carrier-level pricing for nearly every location, provider, and procedure.
On top of that data, Garner applies over 500 proprietary quality and efficiency metrics across 82 distinct subspecialties. Each metric examines a specific aspect of physician performance. Does this doctor unfairly upcode their office bills? Was an MRI prescribed at the right time for the patient? Was an unnecessarily expensive anti-inflammatory chosen when a generic would do the job? Was surgery recommended appropriately? Were there complications afterward? The output is a transparent assessment that can be shared openly with patients and clinicians alike, with no black-box logic in between.
How Garner measures provider performance
Every metric rolls up into two categories: quality, meaning the health outcomes the doctor's patients experience, and total cost of care, meaning the total spending generated across an episode of care. To be recommended to a Garner member, a doctor must outperform local peers in both.
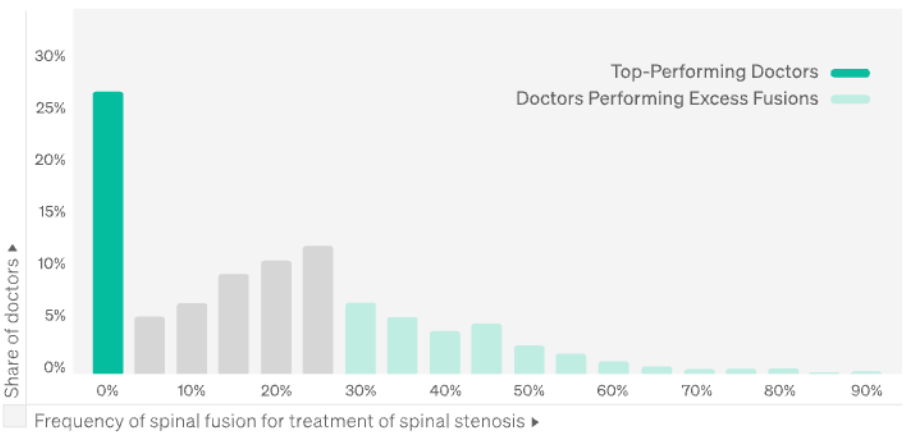
Take spinal fusion as an example. Spinal fusion is the single most costly procedure in the country, costing employers $7.14 per member per month nationally and putting the average employee off work for 42 days. Yet randomized controlled trials in The New England Journal of Medicine have found that, for spinal stenosis (the leading clinical indication where spinal fusion is performed), the surgery produces no better outcomes than much less invasive care. Garner turns this evidence into a metric: do not treat spinal stenosis with spinal fusion unless other clinical issues warrant it.

That single metric reveals enormous variation. Roughly 25% of spine doctors have never performed a spinal fusion for spinal stenosis. That is ideal performance. The remaining 75% show a wide spread, with some doctors performing the surgery on more than 80% of stenosis patients. Garner builds this same pattern of evidence-grounded metrics across hundreds of similar decisions, then aggregates them into a transparent score every member can see.
Inside Assessment of Quality and Total Cost of Care Across Individual Doctors:
- The full quality framework with worked clinical examples for unnecessary echocardiograms, opioid overprescribing, and surgeon-level complication rates
- The total cost of care framework, broken into four subcategories, each paired with metrics employers should ask any vendor about
- A branded combination of two over-the-counter drugs that cost employers $100 million in a single year
- Site of service decisions that can double the cost of a colonoscopy with no clinical benefit
- Hospital-based imaging that routinely costs 3.7 times more than freestanding alternatives
See every metric, framework, and clinical example behind Garner's provider rankings.