What's Driving the Healthcare Cost Crisis?

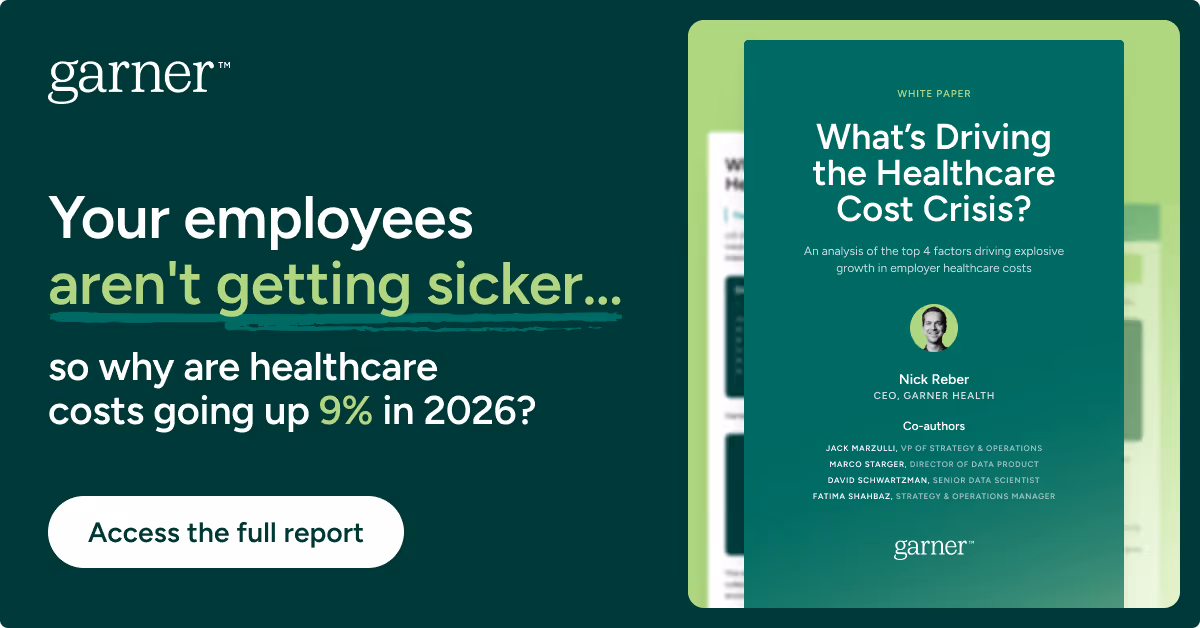
Employers are facing the highest medical trend in over a decade, anticipating a staggering 9% increase in 2026.
Americans aren’t getting sicker – so what’s driving these costs?
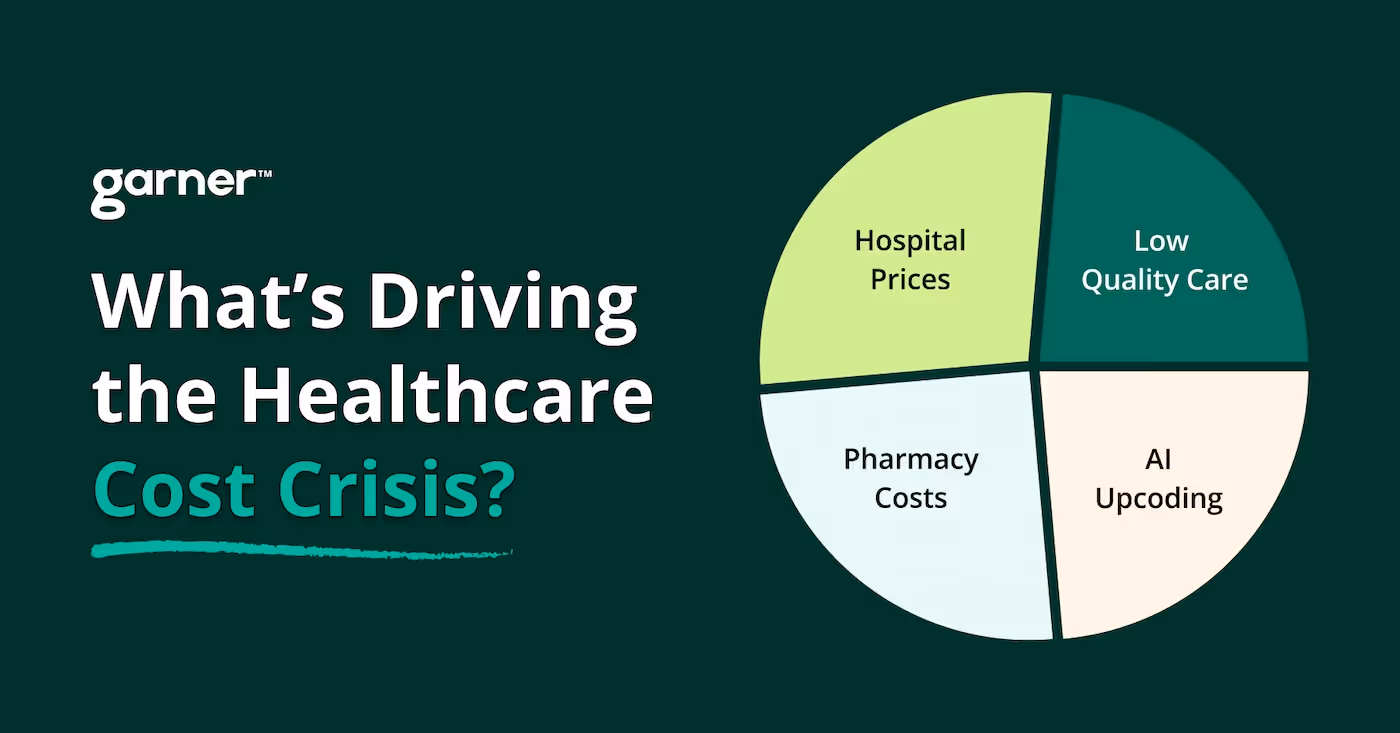
Garner’s proprietary analysis of one of the largest claims dataset in the country identified four systemic “drivers” behind the healthcare cost crisis. Continue reading for a high-level summary or download the report to learn more.
[ACCESS NOW: The full report that dives deep into each cost driver]
Hospital prices represent the single largest increase across all healthcare cost categories. While federal price transparency rules were intended to spark competition and drive costs down, they have inadvertently done the opposite. Following the labor inflation spike of 2022, hospitals used newly public data to identify where they were “under-market”. Our analysis found that hospitals in the “least expensive” bracket leveraged this data to negotiate annual price increases exceeding 10%—nearly four times the rate of their high-cost peers, which contribute a whopping 2% to employer spend in 2026.

Driver 2: Rising Pharmacy Costs
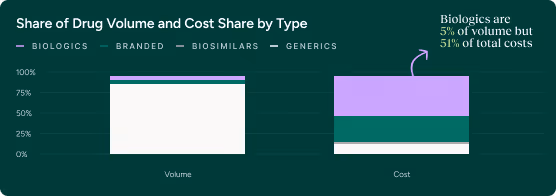
Pharmacy spend is consuming an ever-larger share of the employer dollar, projected to hit 15.9% of total health expenditure by 2025. The primary engine of this growth is the biologic market. High-cost biologics like Ozempic and Humira drive 51% of total pharmacy costs despite making up just 5% of prescription volume. The main reason is that biosimilars - look alike drugs that cost a fraction of biologics - only capture half of available volume. Biosimilars have failed to capture more share due to misaligned PBM incentives that prioritize high-rebate branded products over lower-cost alternatives. These rising pharmacy costs have contributed an additional 1.8% to employer spend.
Driver 3: Low Quality Care
Low-quality providers are significantly more likely to recommend unnecessary surgeries over conservative treatments, creating a compounding cost effect through higher complication rates and long-term mismanagement. These costs are increasing by 8% annually and contributing to a 1.7% increase in employer spend.

Driver 4: AI Upcoding
The healthcare sector has adopted AI at a rate 2.2x faster than the broader economy, with spend tripling last year to $1.4B. However, 89% of that capital is being funneled into back-office tools designed to maximize provider revenue. This has sparked a technological “arms race” where providers use AI to upcode claims while payers use AI to drive higher denial rates. Since 2021, we have seen a steady increase in “severity inflation,” where routine office and ER visits are coded at higher complexity levels to maximize reimbursement, Garner data also shows how some providers may be using AI to artificially increase the “utilization” of their services. This upcoding leads to a 1.7% increase in employer spend.

What can employers do about it?
Traditional strategies like cost shifting to employees, narrowing networks, and relying on carrier discounts have failed to slow employers’ ballooning healthcare trend. But employers have another powerful lever available: steering employee demand to better doctors.
Read the report to learn more about how top doctors use more cost effective sites of service, prescribe more effectively, and upcode at lower rates – helping protect employers from the very factors that are driving the cost crisis.